Download as a pdf
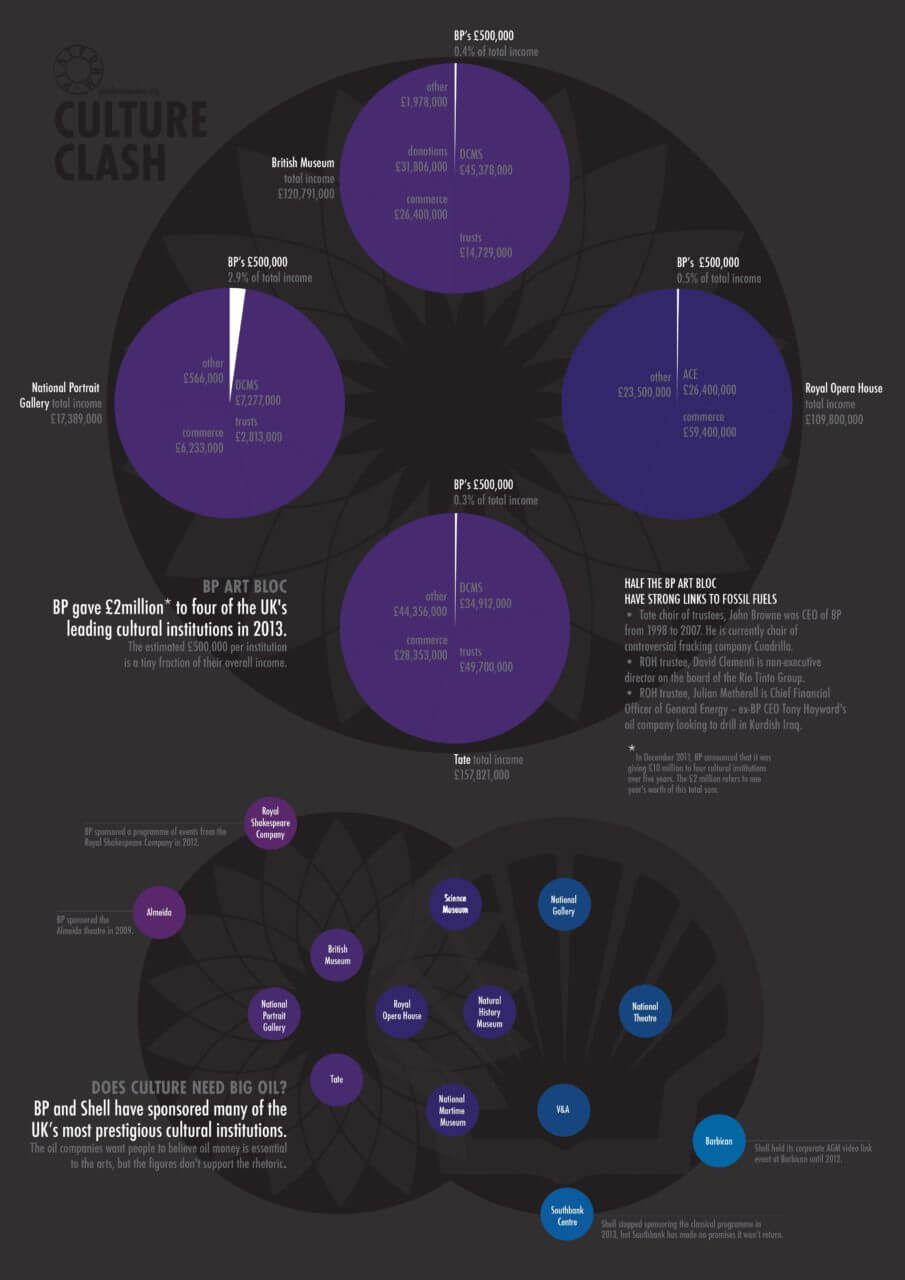
At the end of 2011, BP announced a £10 million sponsorship deal for four of London’s flagship cultural institutions over a five year period. The Culture Clash infographic shows pie charts of the four institutions – Tate, British Museum, Royal Opera House and the National Portrait gallery and breaks down their total 2013 budget according into public funding, trusts, commerce etc alongside the average that each institution would receive from BP if the money was allocated equally over the course of the five years i.e. £500,000 a year.
The research shows that using the £500,000 figure, BP’s sponsorship money represents:
- 0.3% of Tate’s total income
- 0.4% of the British Museum’s total income
- 0.5% of the Royal Opera House’s total income
- 2.9% of the National Portrait Gallery’s total income.
For the last two and a half years Tate has been involved in a Freedom of Information struggle over its refusal to disclose information over details and discussions over its sponsorship relationship with BP. Despite a ruling from the Information Commissioner in May that Tate was breaking information law on a number of counts in not revealing information regarding to sponsorship discussions, Tate has appealed and the tribunal hearing is likely to place in September 2014.
All figures based on 2013 annual reports.
Based on research by Mel Evans
Design by Hannah Davey
Additional input by Jane Trowell and Kevin Smith
